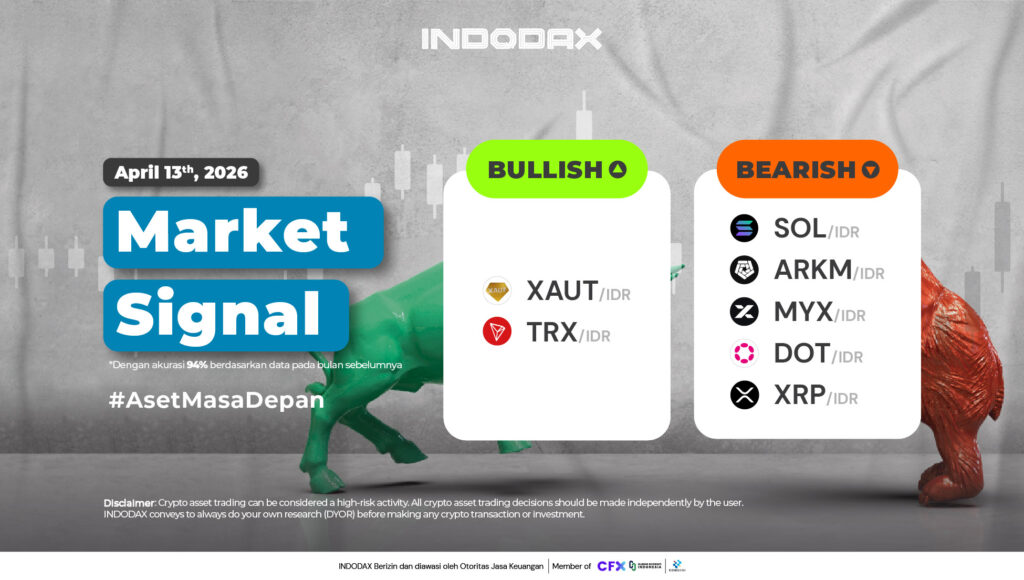
This week, the bullish crypto lineup is led by Tether Gold (XAUT) in first place, followed by Tron (TRX).
Want to know how your favorite crypto asset is performing? Check INDODAX Market Signal below!
2 Bullish Crypto Assets
1.Tether Gold (XAUT)

The trend has the potential to strengthen if the candle remains above the EMA/200.
2.Tron (TRX)

There is a big chance of strengthening the Tron (TRX) trend, currently Tron (TRX) is still indicated to be in the Bullish phase. This phase can survive and continue positive changes with the trend successfully breaking through the 5,600 – 8,000 area.
5 Bearish Crypto Assets
1.Solana (SOL)

The expected decline has not yet moved from Solana (SOL), currently Solana (SOL) is still trying to penetrate the 1,700,000 – 2,000,000 area.
2.Arkham (ARKM)

Still under pressure from the negative phase, Arkham (ARKM) has not experienced significant strengthening, with the trend still being depressed below the EMA/200.
3.MYX Finance (MYX)

The lack of price movement has caused MYX Finance (MYX) to stagnate, with the MACD indicator still showing similar signs.
4.Polkadot (DOT)

Confirmed to be in a Bearish phase since March 2, 2025, Polkadot (DOT) has weakened quite deeply by up to 60%.
5.XRP (XRP)

XRP’s decline is likely to head towards the 19,000 – 21,000 area, failing to hold above this level will deepen the Bearish phase.
NOTE: If the 5 EMA crosses the WMA 75, 85 and 200 EMA lines and the lines intersect from the bottom up, then the market trend tends to go up (bullish), each table above shows that if the 5 EMA value is higher than the 75.85 WMA and 200 EMA, the market tends to go up (bullish).
If the RSI and MACD values ??show the same condition, it means that the market is showing the same trend. Overbought or oversold conditions are an indicator that the market is already at the point of changing direction of a trend.
ATTENTION: All contents which includes text, analysis, predictions, images in the form of graphics and charts, as well as news published on this website, is only used as trading information, and is not a recommendation or suggestion to take action in transacting either buying or selling. certain crypto assets. All crypto asset trading decisions are independent decisions by the users. Therefore, all risks arising from it, both profit and loss, are not the responsibility of Indodax.
 Market