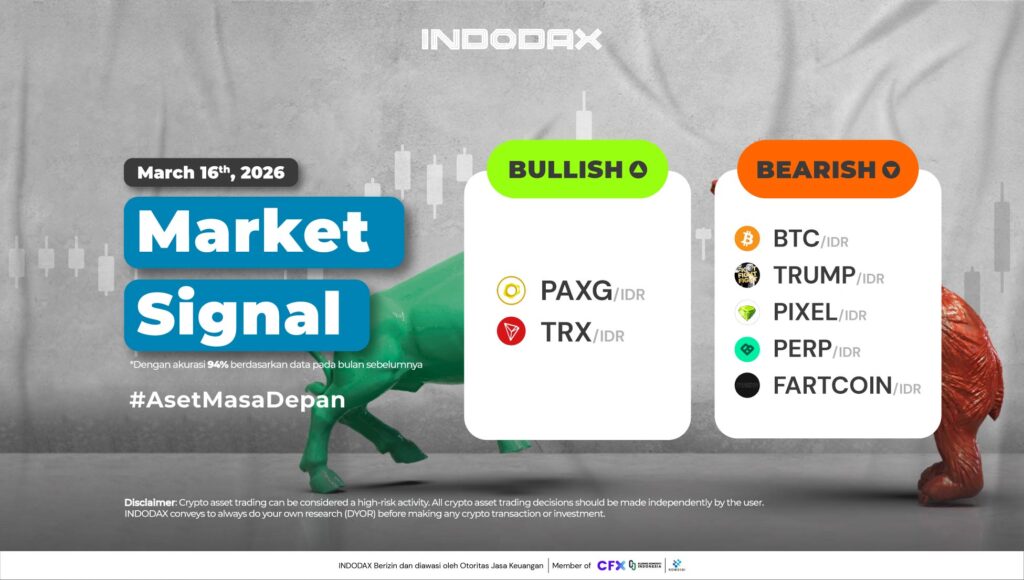
This week, the bullish crypto lineup is led by Pax Gold (PAXG) in first place, followed by Tron (TRX) .
Want to know how your favorite crypto asset is performing? Check INDODAX Market Signal below!
2 Bullish Crypto Assets
1.Pax Gold (PAXG)
Pax Gold (PAXG) failed to break through the 93,000,000 – 96,000,0000 area, causing the trend to experience a correction. Support is indicated in the range of 75,000,000 – 80,000,000. If it is broken, it will be in line with the movement predicted by the MACD indicator.
2.Tron (TRX)
Tron (TRX) has been strengthening since March 11, 2026. The candlestick held above the 200-EMA, followed by a trend that successfully broke through resistance at around 4,850-4,950. Tron (TRX) is expected to attempt to reach the 5,200-5,400 price level.
5 Bearish Crypto Assets
1.Bitcoin (BTC)
Bitcoin (BTC) successfully rebounded the trend failed to break through the Support area of ??1,020,000,000 – 1,100,000,000 making Bitcoin (BTC) head towards breaking through the WMA/85.
2.Official Trump (TRUMP)
The Official Trump (TRUMP) trend indicates a fairly positive trend improvement, as indicated by the MACD indicator crossing upwards. The candlestick’s persistence above the 85-day moving average (WMA) increases the chances of Official Trump (TRUMP) breaking through the 80,000-100,000 resistance area.
3.Pixels (PIXEL)
Showing a positive response, Pixels (PIXEL) held above the Support area of ??50 – 80 trend then Rebounded by breaking through the price of 115 – 150 so that Pixels (PIXEL) was indicated to move above WMA/75.
4.Perpetual Protocol (PERP)
Prices move bearishly sideways in the range of 390 – 1,100. The Bollinger Bands indicator depicts a similar thing, if one of the lines is broken it will create a new trend.
5.Fartcoin (FARTCOIN
The price did not experience any significant changes, either strengthening or weakening, Fartcoin (FARTCOIN) only moved stagnantly, requiring more time to confirm the direction of the next trend movement.
NOTE: If the 5 EMA crosses the WMA 75, 85 and 200 EMA lines and the lines intersect from the bottom up, then the market trend tends to go up (bullish), each table above shows that if the 5 EMA value is higher than the 75.85 WMA and 200 EMA, the market tends to go up (bullish).
If the RSI and MACD values ??show the same condition, it means that the market is showing the same trend. Overbought or oversold conditions are an indicator that the market is already at the point of changing direction of a trend.
ATTENTION: All contents which includes text, analysis, predictions, images in the form of graphics and charts, as well as news published on this website, is only used as trading information, and is not a recommendation or suggestion to take action in transacting either buying or selling. certain crypto assets. All crypto asset trading decisions are independent decisions by the users. Therefore, all risks arising from it, both profit and loss, are not the responsibility of Indodax.
 Polkadot 2.25%
 BNB 0.52%
 Solana 4.62%
 Ethereum 2.32%
 Cardano 1.02%
 Polygon Ecosystem Token 1.87%
 Tron 2.75%
 Market