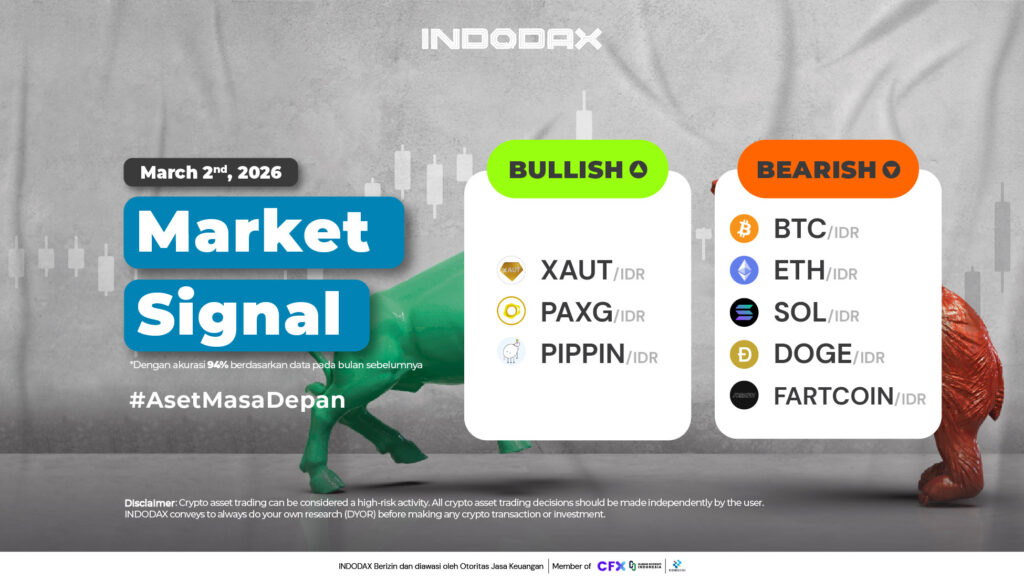
This week, the bullish crypto lineup is led by Tether Gold (XAUT) in first place, followed by Pax Gold (PAXG) and Pippin (PIPPIN).
Want to know how your favorite crypto asset is performing? Check INDODAX Market Signal below!
3 Bullish Crypto Assets
1.Tether Gold (XAUT)
On the 1-day timeframe, the trend is indicated to be in a positive phase, with the MACD indicator showing an upward crossover. Maintaining the trend above the 95,000,000-105,000,000 level offers the opportunity for further strengthening.
2.Pax Gold (PAXG)
The Bullish phase is estimated to be suppressed by the failure of the Candle to stay above the 70,000,000 – 80,000,000 area.
3.Pippin (PIPPIN)
The MACD indicator shows that if Pippin (PIPPIN) is in a negative direction, this indirectly affects the change in Pippin (PIPPIN). Crucial support is in the 6,000 – 7,500 area. If it is broken, the Bullish trend will most likely fail to continue.
5 Bearish Crypto Assets
1.Bitcoin (BTC)
The RSI indicator shows that Bitcoin (BTC) briefly touched the overbought area, and it has now moved away from that area. Bitcoin (BTC) is strengthening, attempting to break through the 1,200,000,000-1,300,000,000 area.
2.Ethereum (ETH)
Failure to penetrate the 60,000,000 – 70,000,000 area followed by Candle also failing to penetrate the EMA/200 has a negative impact on the change in the Ethereum (ETH) trend, confirming the Bearish phase movement.
3.Solana (SOL)
Support is indicated to be in the 1,100,000 – 1,300,000 area. By breaking through this area, bears will increasingly dominate the next trend change.
4.Dogecoin (DOGE)
Currently, Dogecoin (DOGE) is moving below the WMA/85 with selling momentum dominating over buying. The weakness can be corrected by breaking the candle above the 2,000-2,600 level.
5.Fartcoin (FARTCOIN)
Fartcoin (FARTCOIN) trend remains unchanged from the WMA/85, with the lack of positive momentum causing the price to stagnate within a range of 2,500-4,500.
NOTE: If the 5 EMA crosses the WMA 75, 85 and 200 EMA lines and the lines intersect from the bottom up, then the market trend tends to go up (bullish), each table above shows that if the 5 EMA value is higher than the 75.85 WMA and 200 EMA, the market tends to go up (bullish).
If the RSI and MACD values ??show the same condition, it means that the market is showing the same trend. Overbought or oversold conditions are an indicator that the market is already at the point of changing direction of a trend.
ATTENTION: All contents which includes text, analysis, predictions, images in the form of graphics and charts, as well as news published on this website, is only used as trading information, and is not a recommendation or suggestion to take action in transacting either buying or selling. certain crypto assets. All crypto asset trading decisions are independent decisions by the users. Therefore, all risks arising from it, both profit and loss, are not the responsibility of Indodax.
 Market