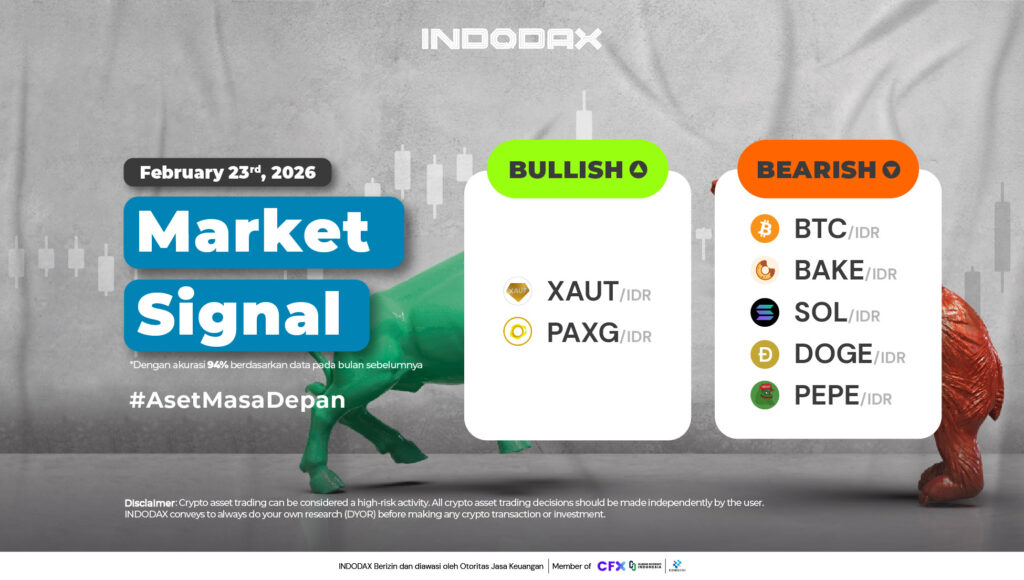
This week, the bullish crypto lineup is led by Tether Gold (XAUT) in first place, followed by Pax Gold (PAXG) .
Want to know how your favorite crypto asset is performing? Check INDODAX Market Signal below!
2 Bullish Crypto Assets
1.Tether Gold (XAUT)
On the 1-day timeframe, Tether Gold (XAUT) remains above the WM/A85 level, indicating a significant upside potential. The MACD indicator will move positively, with Tether Gold (XAUT) remaining above the support level of 77,000,000 – 82,000,000.
2.Pax Gold (PAXG)
The MACD indicator is expected to be in a positive phase, supported by indications of a bullish trend. Resistance is available in the 92,000,000-100,000,000 area.
5 Aset Crypto Bearish
1.Bitcoin (BTC)
Indicated to be in a bearish phase since November 28, 2025, Bitcoin (BTC) has weakened by more than 30%, negatively impacting the overall trend of Bitcoin (BTC). Bitcoin (BTC) has hit its lowest price since October 2024.
2.Bakery Token (BAKE)
Strengthening has not yet formed, Candle is still under pressure with movement below the WMA/85 MACD indicator indicates a positive movement but is not directly proportional to the price movement of Bakery Token (BAKE).
3.Solana (SOL)
Solana (SOL) is currently estimated to be experiencing a weakening trend on the 1-Day chart, the MACD indicator still indicates strengthening but overall Solana (SOL) is still weakening.
4.Dogecoin (DOGE)
Support is indicated in the range of 1,100 – 1,300. If it fails to hold, the bearish trend will become stronger and continue. The MACD indicator will confirm a downward crossover.
5.Pepe (PEPE)
The candle is still holding above the Support area of ??0.05 – 0.06, the MACD indicator still shows positive movement on Pepe (PEPE), the nearest Resistance is in the area of ??0.08 – 0.1.
NOTE: If the 5 EMA crosses the WMA 75, 85 and 200 EMA lines and the lines intersect from the bottom up, then the market trend tends to go up (bullish), each table above shows that if the 5 EMA value is higher than the 75.85 WMA and 200 EMA, the market tends to go up (bullish).
If the RSI and MACD values ??show the same condition, it means that the market is showing the same trend. Overbought or oversold conditions are an indicator that the market is already at the point of changing direction of a trend.
ATTENTION: All contents which includes text, analysis, predictions, images in the form of graphics and charts, as well as news published on this website, is only used as trading information, and is not a recommendation or suggestion to take action in transacting either buying or selling. certain crypto assets. All crypto asset trading decisions are independent decisions by the users. Therefore, all risks arising from it, both profit and loss, are not the responsibility of Indodax.
 Market