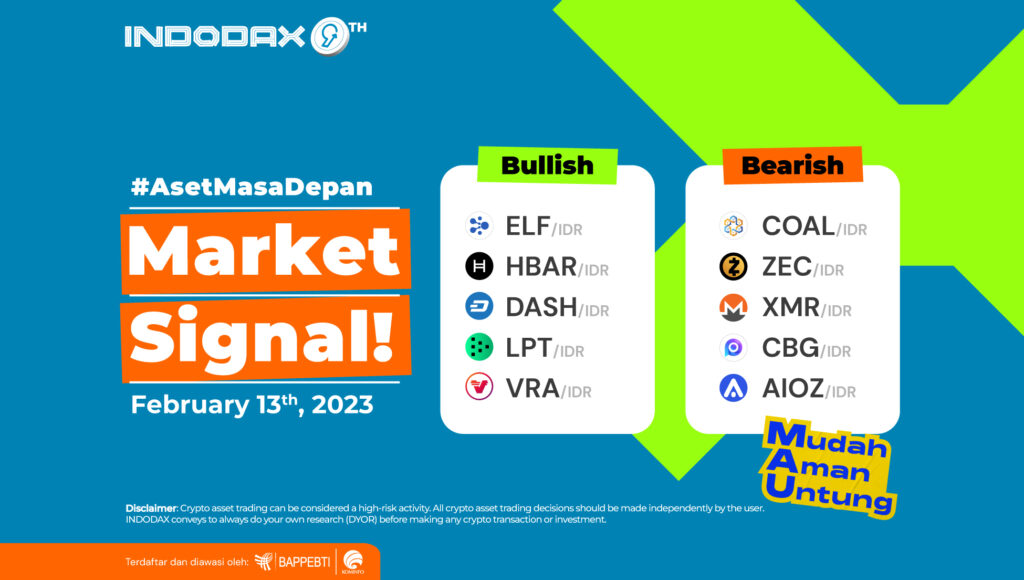
Hello Indodax members! Entering mid-February 2023, ELF and HBAR occupy the top positions for bullish crypto assets. What’s next for crypto assets? Let’s read more!
5 Bullish Crypto Assets
aelf (ELF)

Being stuck in the 1,550 – 1,840 area is a positive momentum for ELF to experience a reversal to strengthen and can penetrate several levels that are strong enough to withstand price increases, such as 2,180 and 2,300 so that ELF can enter the Uptrend phase.
If the candle can form above 3,800 – 4,250, it will provide a new direction for aelf in the Uptrend phase.
Hedera Hashgraph (HBAR)

It is indicated that the HBAR has been in the bullish phase since January 14, 2023, and has experienced a reasonably high strengthening.
Since entering the bullish phase, it has risen to around 90%. This increase is in line with the current trend picture by the RSI indicator, which is already in the Overbought area.
The bullish phase at HBAR will be suppressed if the price weakens and breaks the support level at 1,260. The price continues to weaken until it returns to the 1,000 – 1,110 area range.
DASH (DASH)

The 4-hour chart indicates that DASH had several gaps in the trend. The MACD indicator shows that if the current price movement is indicated to be in the positive zone with a positive histogram, the strengthening that occurs will try to break the resistance area of 1,005,000 – 1,050,000.
Livepeer (LPT)

The increase in LPT is inseparable from the ability of the trend to break out from the EMA/200, which is quite strong. The direction of the Bullish trend will be stronger if a candle with the complete form can form above the price of 180,000.
Before breaking through that level, the price will move quite dynamically. With an estimated Support level of around 103,700 – 130,000.
Veracity (VRA)

The break of WMA/85 became a momentum for VRA to fluctuate. Still, in a positive direction, the Bollinger Bands indicator illustrates if the two lines are far from each other, thus indicating that Verasity will move quite dynamically.
This dynamic trend movement will make the opportunity to penetrate the Resistance and Support levels very wide open. VRA has a Resistance level of 175 – 215. On the other hand, the Support level is at 110 – 130.
5 Bearish Crypto Assets
Coalculus (COAL)

The Coalculus trend continues to decline after touching the 195 price range, the highest price since May 16, 2021, followed by the trend’s inability to stay above the EMA/200 line. Any weakness in COAL will try to test the support area around 40 – 48.
Zcash (ZEC)

ZEC was inseparable from the change from a Bullish to a Bearish phase, a Bearish trend that has occurred since May 14, 2022, where prices have weakened by around 50%. The trend is seen above WMA/85 with a strengthening which, if it occurs, will try to go to the 754,000 – 870,000 area.
Monero (XMR)

If you identify the trend that is currently happening, on February 10, 2022, Monero was in the Bearish zone and passed Support in the price range of 2,500,000 – 2,540,000, which is one of the reasons. If the trend can move stronger to pass the EMA/200, it will allow XMR to correct the weakening trend.
Chainbing (CBG)

Using the 4-hour chart time, CBG entered the Bearish phase on February 7, 2023. This is confirmed by the inability of the Support level in the 21,000 – 21,720 area to withstand the weakening of the candle.
The downward trend will try to test the Support line 19,500 – 20,000. If it is passed, then the negative momentum will get bigger.
The MACD indicator indicates that if CBG is trending in a negative zone, but with non-volatile movements with an estimate that the price will move in the range of 22,000 – 24,300, the price will create a new direction of movement for Chainbing if it can penetrate one of these levels.
AIOZ Network (AIOZ)

AIOZ is experiencing movement above WMA/85, so it will have the opportunity to able to pass through several resistance levels, such as 715 – 910 and 1.125 – 1.455, with the assumption that if it can break these levels, then the indication for strength to hold above EMA/200 will be even greater.
NOTE: If the 5 EMA crosses the WMA 75, 85 and 200 EMA lines and the lines intersect from the bottom up, then the market trend tends to go up (bullish), each table above shows that if the 5 EMA value is higher than the 75.85 WMA and 200 EMA, the market tends to go up (bullish).
If the RSI and MACD values ??show the same condition, it means that the market is showing the same trend. Overbought or oversold conditions are an indicator that the market is already at the point of changing direction of a trend.
ATTENTION: All contents which includes text, analysis, predictions, images in the form of graphics and charts, as well as news published on this website, is only used as trading information, and is not a recommendation or suggestion to take action in transacting either buying or selling. certain crypto assets. All crypto asset trading decisions are independent decisions by the users. Therefore, all risks arising from it, both profit and loss, are not the responsibility of Indodax.
 Market

