There are various patterns that can help traders in making transactions, including Head and Shoulders. Its shape is easily recognized compared to other patterns and its ability as a tool, makes it the main analytical weapon for novice traders studying technical analysis. “Head and Shoulders” is one of the important trend reversal patterns in technical analysis. This pattern is formed when there are three price peaks in a row, with the middle peak (head) being higher than the other two peaks (shoulders), and indicates a trend reversal from bullish (up) to bearish (down). When this pattern forms, traders often view it as a signal that the existing uptrend is ending and prices will likely fall.
On the other hand, the relevance of the “Head and Shoulders” pattern in technical analysis is very large. Traders use this pattern as a cue to enter sell (short) trades after a significant uptrend. When the price falls below the neckline connecting the two bottom points of the “Head and Shoulders” pattern, this can be considered confirmation that a new bearish trend has begun.
The advantage of this pattern is that it can be found in a variety of markets, including crypto and stock markets. Crypto and stock traders often use these patterns to make smart trading decisions, exploiting potential profits from significant trend changes.
Read the following review to understand more about the Head and Shoulders pattern, its characteristics, the advantages and disadvantages of using this pattern in trading, for example, how to read it, and how to use it in crypto trading!
What is the Head and Shoulders Pattern?
The Head and Shoulders pattern indicates a change in trend from bullish (up) to bearish (down). A reversal signal occurs when the price breaks the neckline downwards after the formation of this pattern. Traders use this pattern to identify potential trend reversals and often use it as a signal to enter a sell (short) trade once confirmation of a trend reversal has occurred.
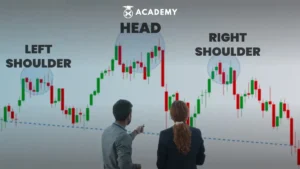
Basically, the Head and Shoulders pattern consists of four main parts. First is the head, then the left shoulder, followed by the right shoulder, and finally the neckline.
Each part of this pattern has a special role in technical analysis, with the following details:
- Left Shoulder: indicates a price peak followed by a decline.
- Head: the higher price peak in the pattern.
- Right Shoulder: another fall, followed by a rise that forms a peak lower than the head.
- Neckline: the line that connects the left shoulder and right shoulder points.
Please note, that many people think that the Head and Shoulders pattern is similar to Elliot waves. Both of these patterns show a strong trend followed by a correction. However, in the case of Head and Shoulders, a trend reversal occurs when the price breaks the neckline. The steeper the slope of the neckline, the higher the probability of a trend reversal.
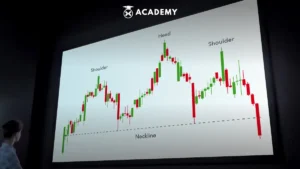
On the other hand, if this pattern is illustrated in a graph, it will show three peaks forming sequentially. The first peak is the left shoulder, followed by the highest peak, the head, and the final peak is the right shoulder. Between the left and right shoulder is a horizontal line called the neckline.
Head and Shoulders Pattern in Crypto
The Head and Shoulders Pattern is an important pattern that can be found in technical analysis, not only in the stock market but also in the crypto market. However, some differences and special considerations exist when identifying and using these patterns in a crypto context.
Some similarities in crypto and stock analysis are as follows:
- The Head and Shoulders pattern applies to various markets, including crypto and stocks. The basic principle of this pattern remains the same in all markets.
- In crypto and stocks, the Head and Shoulders pattern identifies potential trend reversals from bullish to bearish or vice versa.
Meanwhile, there are a number of differences in crypto and stock analysis, including:
- Crypto markets tend to be much more volatile than stock markets. This volatility can cause patterns, including Head and Shoulders, to appear and disappear quickly. Therefore, pattern confirmation with stable price movements is crucial in crypto.
- News and current events can heavily influence market sentiment in crypto, resulting in sharp and rapid price changes. This can affect the reliability of the Head and Shoulders pattern as a reversal signal.
When using the Head and Shoulders Pattern in crypto, it is important to understand the high volatility inherent in this market. Volatility can cause extreme price fluctuations, making patterns appear to form and then quickly disappear. As a result, traders must be alert and wait for strong confirmation before making trading decisions based on the Head and Shoulders pattern, especially in the crypto market.
Head and Shoulders Pattern Characteristics
The Head and Shoulders pattern is a graphic pattern that often occurs in technical analysis. This pattern usually appears when prices are in an uptrend and signals a potential reversal.
The structure of this pattern consists of three peaks that form a “head” in the middle, surrounded by two “shoulder” peaks on the right and left sides. The following are the main characteristics of the Head and Shoulders pattern, namely:
- Left Shoulder: This is the first peak on the pattern’s left side. The price increases towards this peak point before experiencing a decline, although it does not reach the previous low.
- Head: This is the largest peak that forms in the middle of the pattern. After forming the left shoulder, the price rose again, reached a new high, then fell again.
- Right Shoulder: This is the second peak on the pattern’s right side. The price rises again after forming a head, reaching a level similar to the left shoulder, before falling again.
The Head and Shoulders pattern is considered a bearish signal and signals a possible trend reversal from up to down. Usually, pattern confirmation occurs when the price breaks the neckline connecting the two lows below the head.
This is a signal to open a sell position. Potential targets for this pattern can be calculated by measuring the distance from the neckline to the top of the head and then projecting it downward after breaking the neckline.
Advantages and Disadvantages of Using the Head and Shoulders Pattern for Trading
Recognizing the advantages and disadvantages of the Head and Shoulders Pattern is very important in the world of trading and technical analysis.
By understanding the Head and Shoulders pattern’s advantages and disadvantages, traders can make better trading decisions and help them plan more effective strategies in the financial markets.
The following are some of the advantages and disadvantages of the Head and Shoulders pattern that you need to know, namely:
1. Advantages
- Experienced traders can easily recognize the Head and Shoulders pattern, allowing them to make faster and smarter trading decisions.
- These patterns help traders determine the level of risk and potential profits that may result thereby providing a clear framework for risk management.
- Useful in all financial markets, including stocks, crypto, and foreign currencies, allowing traders to utilize these patterns in a variety of market situations.
- This pattern has the potential to trigger significant price movements upon confirmation, thus providing profitable trading opportunities for traders who understand and use this pattern appropriately.
2. Disadvantages
- Beginner traders often find identifying the Head and Shoulders pattern difficult because it requires a deep understanding of technical analysis. Intensive education and training are needed to overcome these obstacles.
- Prices often experience retracement or reverse movement after the formation of the Head and Shoulders pattern, which can confuse beginners and even experienced traders. Deep knowledge of risk management and a deep understanding of pattern confirmation can help overcome this problem.
- Although this pattern can provide a strong reversal signal, the risk of loss also remains. This pattern does not always produce profits, and traders should always consider other market factors before making trading decisions.
Head and Shoulders Pattern Examples
Understanding the Head and Shoulders pattern is crucial for traders who want to make smarter trading decisions. In the chart below, Apple’s stock price movement from late 2021 to early 2022 highlights a head and shoulders pattern.
In the first shoulder, from early to mid-December, share prices increased until they reached their peak, then fell. Prices bottom out before rallying again towards the end of December, forming a new peak in early January, called the head.
Next, the stock price falls before reaching a new low again. The top of the next rally forms the second shoulder. When the price decline breaks through the same price levels as those seen at the end of the first shoulder and the beginning of the second shoulder, market sentiment turns negative (bearish). The line connecting these lows is known as the neckline, and the price movement that penetrates this line downwards is called a breakdown.
In Apple’s case, losses reached price levels not seen since November. The stock remained stable before rallying after a strong quarterly earnings release and record earnings. It is important to note that ideally, the peaks of the first and second shoulders should be at the same price level, although this is not always the case.

Image source: gicindonesia.com
A Head and Shoulders pattern in Apple stock began to form in early December and declined until around January, reaching levels not seen for about two months.
The following is an example of a Head and Shoulders pattern formed on a Bitcoin candlestick chart. After forming a left shoulder, a head, and a right shoulder, the crypto experienced a decline through the neckline, signaling a continuation of the price decline.
In this example, the right shoulder is relatively small. The absence of a significant price rally indicates strong selling pressure before further declines occur. This pattern is known as the Head and Shoulders Top Chart pattern.

Image source: gicindonesia.com
How to Read the Head and Shoulders Pattern
It is important to pay attention to several key elements to read the Head and Shoulders (HNS) pattern on a chart. Carefully understanding all the elements below will help traders make better and smarter decisions when facing the Head and Shoulders pattern in dynamic market situations.
The following is how to read the Head and Shoulders pattern on the chart, namely:
1. Identify Patterns
Look for signs of a Head and Shoulders pattern on the chart. This pattern consists of three peaks, namely the “head” in the middle which is higher than the two “shoulders” on the left and right sides.
2. Neckline
Determine the horizontal line connecting the two valleys below the head. This line is important as the main support level in the Head and Shoulders pattern. Next, pay attention to whether the price is able to penetrate the neckline or is still above it.
3. Trading Volume
Observe the trading volume during the formation of the Head and Shoulders pattern. The volume that increases as the head forms and decreases as the shoulders form can provide an indication of the strength and validity of the pattern.
4. Confirmation Signal
If the price manages to break the neckline downwards, this signals confirmation that the Head and Shoulders pattern is likely to end and a new downward trend can begin. This confirmation can be strengthened by an increase in trading volume as well as the formation of a bearish candlestick.
5. Price Target
Project the pattern high from the neckline down after the breakout to estimate potential price targets for the next move.
How to Use the Head and Shoulders Pattern in Crypto Trading
It is important to know that the Head and Shoulders pattern is a popular technical analysis tool in crypto trading. Therefore, understanding how to use this pattern in crypto trading is important. The following are the steps for using this pattern in crypto trading, namely:
1. Identify Patterns
Identify the Head and Shoulders pattern on the crypto price chart. This pattern consists of three peaks, with the largest in the center, called the head and the two lower ones on the sides called the shoulders.
2. Confirm the Neckline
Draw a horizontal line connecting the two valleys under the right and left shoulders. This line is an important support level. A price break below this line indicates a sell signal.
3. Determination of Entry Point
A sell signal appears when the price breaks the neckline downwards. Traders may consider opening a sell position at this point, anticipating further price declines.
4. Placement of Stop Loss
To manage risk, traders can place a stop loss a few pips above the neckline. This helps protect positions from unwanted price movements.
Conclusion
In conclusion, the “Head and Shoulders” pattern is one of the important trend reversal patterns in technical analysis. This pattern is formed when there are three price peaks in a row, with the middle peak (head) being higher than the other two peaks (shoulders). This pattern indicates a trend reversal from bullish (up) to bearish (down). When this pattern forms, traders often view it as a signal that the existing uptrend is ending and prices will likely fall.
Some of the advantages of this pattern are that it is easy to recognize by experienced traders, helps traders determine the level of risk and potential profits that may be generated, is useful in all financial markets, including stocks, crypto, and foreign currencies, and has the potential to trigger price movements significant after confirmation occurs.
It is also important to highlight that the “Head and Shoulders” pattern can be useful in crypto analysis if used carefully. By understanding the characteristics and basic principles of these patterns, crypto traders can identify potential trend reversals or continuation of existing trends in the crypto market.
Learn about Crypto on INDODAX Academy
So, now you understand the Head and Shoulders pattern. Furthermore, you can also read other interesting articles, such as complete chart patterns to harmonic patterns on INDODAX Academy. It is important to remember that INDODAX Academy is a place for anyone to deeply deepen their knowledge of crypto assets and understand blockchain technology.
After gaining a solid understanding of the world of crypto assets and blockchain technology through INDODAX Academy, the next step is to start investing in crypto assets on INDODAX. However, before starting a crypto investment in INDODAX, it is highly recommended to download this best and most trusted crypto application first. By using the INDODAX platform, you can safely, easily, and efficiently start investing in the crypto world.
Expand your knowledge and discover the limitless potential of the crypto world on INDODAX Academy!
 Market

