Hello, great Indodax loyal traders! We would like to share some good news for the fourth week of August 2023. The crypto market is currently in a very encouraging bullish trend, especially for the crypto asset Maker (MKR) coin and XinFin Network (XDC).
This trend offers a golden opportunity for traders looking to make significant profits.
In order to optimize your profit potential, we will present the latest information below so that you can make the right trading decisions for maximum results.
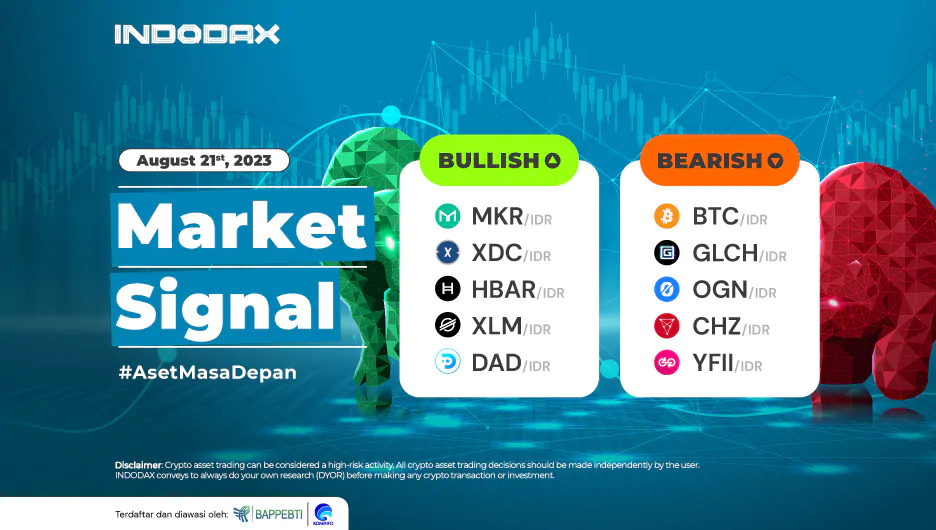
5 Bullish Crypto Assets
1. Maker (MKR) Coin

Being in the uptrend zone on July 20, 2023, had quite a positive impact, and in line with the direction of the trend change that has occurred in the Maker (MKR) coin, the price has strengthened by around 30%. The bullish trend is assumed to be stronger to continue if the resistance level, which is in the price range with a wide enough position of 20,500,000–25,000,000, can be passed and a candle is formed above the resistance.
2. (XDC) XinFin Network – XDC Coin

XinFin Network (XDC) coin was confirmed to be in the bullish zone on July 25, 2023, making the XinFin Network XDC (XDC) coin strengthen to touch the 1,420 level, which is the highest price for XinFin Network since January 2022. The MACD indicator indicates that XDC is in a negative trend, having failed to hold on to the 1,000 level.
The price of the XinFin Network (XDC) coin is currently holding above the WMA/85 line. If a candle is formed below the price range of 690–850, it is expected that XDC will experience high negative pressure.
3. Hedera Hashgraph (HBAR) Token

The bullish Hedera Hashgraph (HBAR) token trend continues to receive considerable pressure to weaken again and frustrate the price increase, but sideways in the 770–825 price range is able to break positively, then the price increases and moves in the direction of the trend. There is a support area available that allows the Hedera Hashgraph (HBAR) token to be tested in the range of 830–930 levels; if it is passed, then the uptrend indication is quite large.
4. Stellar Lumens (XLM) Token
 Even though it is in the bullish zone, the Stellar Lumens (XLM) token is experiencing negative pressure, which is quite dominant compared to positive pressure, where the support area of 1,875–2,080 has been successfully passed. The Stellar Lumens trend will return to continue strengthening if the EMA/75 is able to be penetrated.
5. DAD (DAD) Coin

The price movement of the DAD (DAD) coin on the 4-hour chart is expected to be quite volatile. The Bollinger Bands indicator used shows that if the two lines are far from each other, this will have a large impact on the opportunities for support and resistance to be broken. The uptrend zone will be able to strengthen the further direction of price movement if DAD (DAD coin) can break resistance levels in the 270–320 area
5 Bearish Crypto Assets
1. Bitcoins (BTC)

Unable to stay above EMA/200, followed by a Bitcoin price range of 435,000,000–450,000,000, which was broken down, confirming that Bitcoin is entering a new trend, which is bearish.
One of the indicators used, namely the RSI, indicates that the current trend is in the overbought area. This is fairly reasonable because Bitcoin (BTC) has weakened by more than 5%. Bitcoin (BTC) can improve the weakening trend if resistance in the range of 410,000,000–420,000,000 can be broken.
2. Glitch (GLCH) Coin

Since the trend was in the bullish phase on May 7, 2023, it has had a negative impact on changes in the Glitch coin (GLCH) price, where the price has weakened by more than 60%. Prices that can pass resistance 580–670 will be able to make the trend improve, and the potential for a candle to move above the WMA/85 line will be even greater.
3. Origin Protocol (OGN) Coin

Was in the uptrend phase, but this did not last long because the Origin Protocol (OGN) coin entered a new phase, namely the downtrend, which was inseparable from the price, which continued to weaken and passed the EMA/200. The bearish phase will be unable to continue the trend movement if the price range of 1.450–1.600 is broken and allows the trend to test the 2.000 level.
4. Chiliz (CHZ) Coin

Confirmation of the direction of price movement, but if this area is passed, CHZ coin will touch its lowest level since being traded on Indodax. The price area of 1.230–1.340 will be the CHZ momentum area; if it can be passed, then positive pressure will help the trend to strengthen.
5. DFI.Money (YFII)

Since being in a bearish trend, the price of the DFI.Money (YFII) coin has continued to experience a deep decline. Since January 25, 2023, the DFI.Money (YFII) coin has weakened by around 50%. The weakening that occurred has given an indication to the RSI indicator that the current price is in the oversold zone, with resistance levels at 9,000,000–11,000,000.
So what are you waiting for? Don’t miss this golden opportunity! Get ready to face a bullish trend in the lucrative crypto market, and let’s make profits when investing in crypto.
Let’s join Indodax right now and be at the forefront of traders efforts to get maximum profits.
NOTE: If the EMA 5 crosses the WMA 75, 85, and EMA 200 lines and the lines intersect from the bottom up, then the market trend tends to be up (bullish).
In each table above, it shows that if the EMA 5 value is higher than the WMA 75.85 and EMA 200, then the market tends to rise (bullish).
If the RSI and MACD values show the same condition, it means that the market is showing the same trend. If the condition is overbought (overbought) or oversold (oversold), it is an indicator that the market is at the point of changing the direction of the trend.
ATTENTION: All content, which includes text, analysis, predictions, images in the form of graphics or charts, as well as news published on this website, is only used as trading information and is not a suggestion to take action in a transaction, either buying or selling certain crypto assets.
All crypto asset trading decisions are independent decisions by users. Therefore, all risks arising from it, both profit and loss, are not the responsibility of INDODAX.
 Market