
Currently, candlesticks are the most widely used chart analysis by crypto enthusiasts to monitor price movements and identify trend patterns when carrying out trading activities.
The candlestick has several patterns, including the reversal candle pattern.
The reversal pattern has two candle patterns, often called similar but not the same, namely the Hanging Man and the Hammer.
Hanging Man usually appears when there is an uptrend; this shows that sellers are starting to enter the market and trying to push the price down.
The Hanging Man pattern indicates that the market will start to lose its bullish momentum and has the potential for a trend-turning point.
Whereas Hammer indicates when security has reached its bottom or top, respectively.
The difference between Hammer and Hanging Man can be seen from the different patterns; the Hammer has a long tail and a tail that is short at the top, while the Hanging Man forms like a hammer without having a seat.
The Hammer has two derivative patterns, namely the bullish and bearish Hammer patterns, both of which are the most commonly used chart patterns in technical analysis.
The Bullish and Bearish Hammers are easy to spot, as they look like hammers with their heads pointing downwards or upwards.
This time, INDODAX Academy will discuss what forms the bullish Hammer pattern and how traders can recognize it. Come on, get to know Hammer bullish and how to use it!
What is a Bullish Hammer?

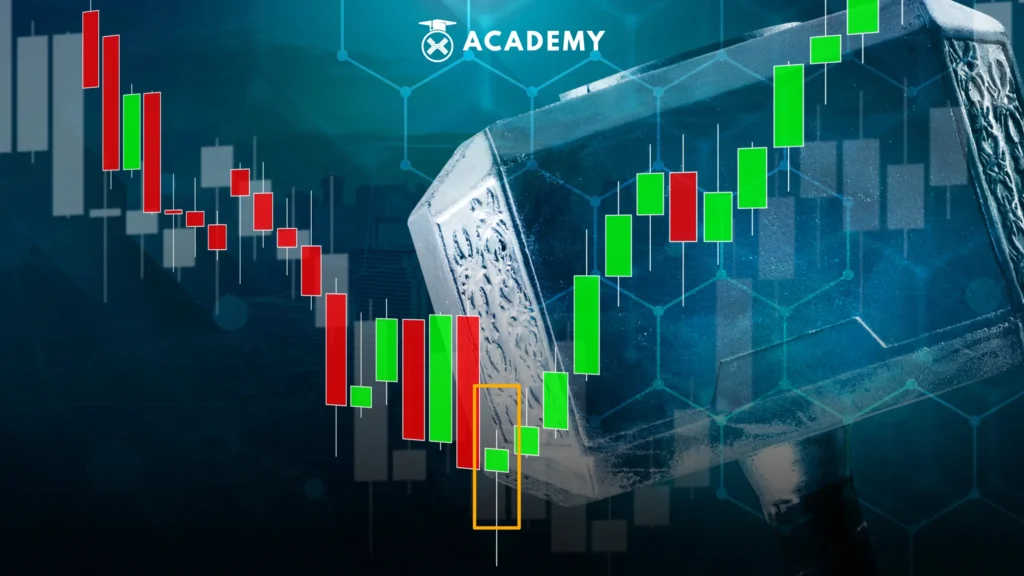
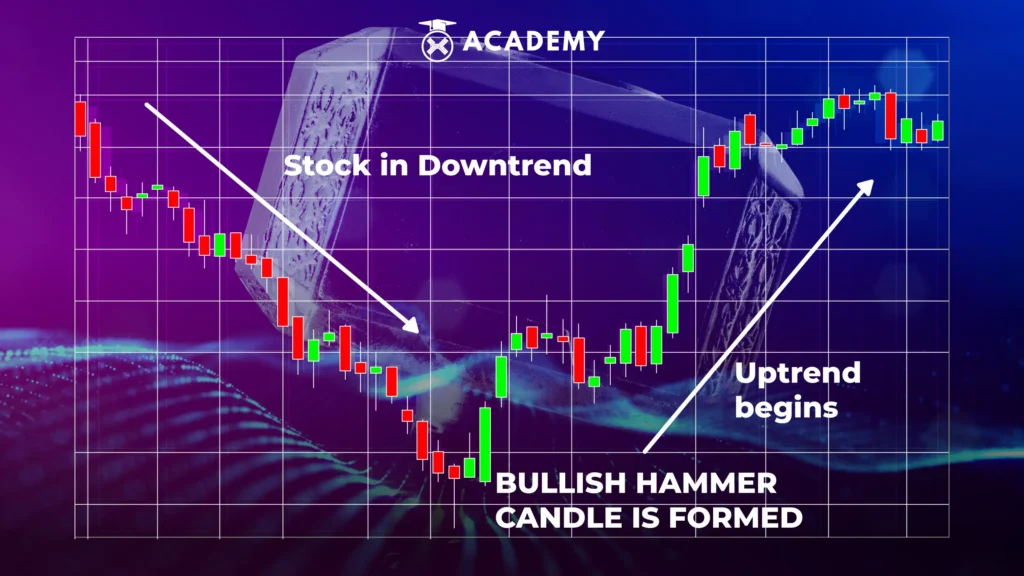
The bullish Hammer is a bullish reversal pattern that reverses the market direction from the initial trend to the reverse trend (uptrend). This pattern is formed at the end of a downtrend session.
The Bullish Hammer is considered a bullish reversal pattern, showing that the buyers are gaining strength in a bearish market.
The sellers started to pull back and forced the price to go higher, forming a Bullish Hammer. This happens when the price moves against the market at a particular time.
Traders can use this pattern as an opportunity to enter long positions. The Bullish Hammer is formed.
The bullish Hammer can usually be referred to as an indication of the first reversal candle, which signals that the candle will go in a positive direction, so that doesn’t mean that the signal from the bullish Hammer can be used as a reference as a time to buy.
We must wait for the next candle, like a bullish Marubozu or a higher green candle.
Bullish hammer function
The function of the bullish Hammer is to indicate that the buyers have taken control of the sellers and are pushing the price higher.
The long lower shadow shows that sellers pushed the price down during the day, but buyers stepped in at some point and pushed the price back near its opening level in late trading.
The bullish Hammer will give an alarm when the price goes down so that when the price reaches the lowest limit, the price will go back up.
Bullish Hammer traits
When the price of an asset decreases, traders expect a trend reversal when they see the Hammer.
This shows that the market is reaching its lowest point, and there is a shift in momentum.
A bullish Hammer is usually marked by signals such as the price falling after opening but being pulled back and closing at a higher price than in one period.
Hammer positions are also vital if three or more bearish candles precede them.
How to Recognize a Bullish Hammer
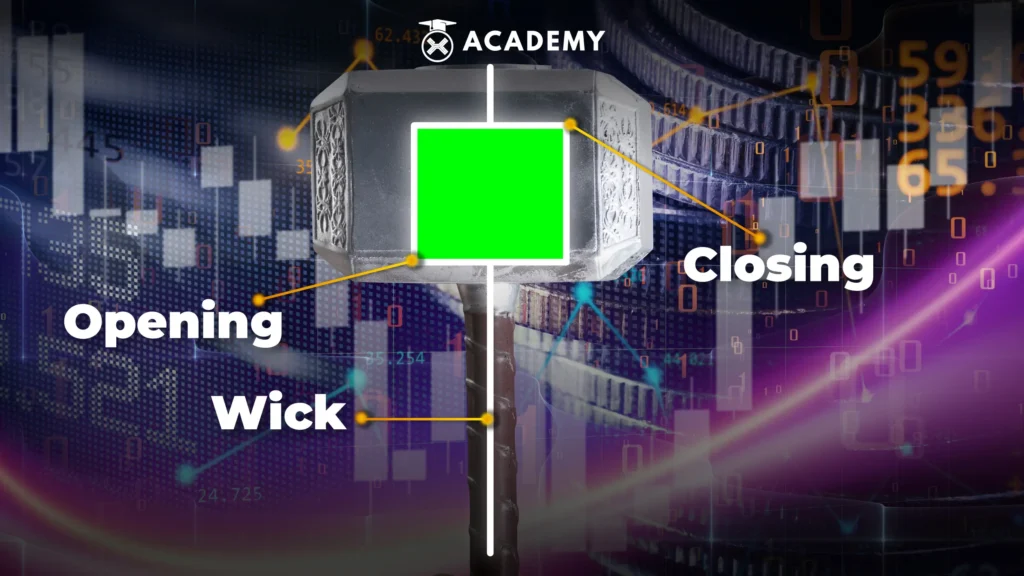
To recognize this pattern, traders must look for a candle with a lower shadow that should be three times or longer than the body.
This candle has a short body and a long wick that is at least 2x the size of the body.
In the Bullish Hammer, there is no very small upper axis. Patterns can exist in any timeframe.
Advantages of Using a Bullish Hammer
Using the bullish Hammer has the following advantages:
- It is easy to spot and trade using this pattern.
- This pattern provides a trading opportunity because it appears quite often.
- In the case of a reversal signal, if it is found in a downtrend, it means the end of the selling pressure and the start of trading back up.
- On an exit signal, traders with short positions may see the hammer candle as a sign of easing selling pressure. This is also the ideal time to close short positions.
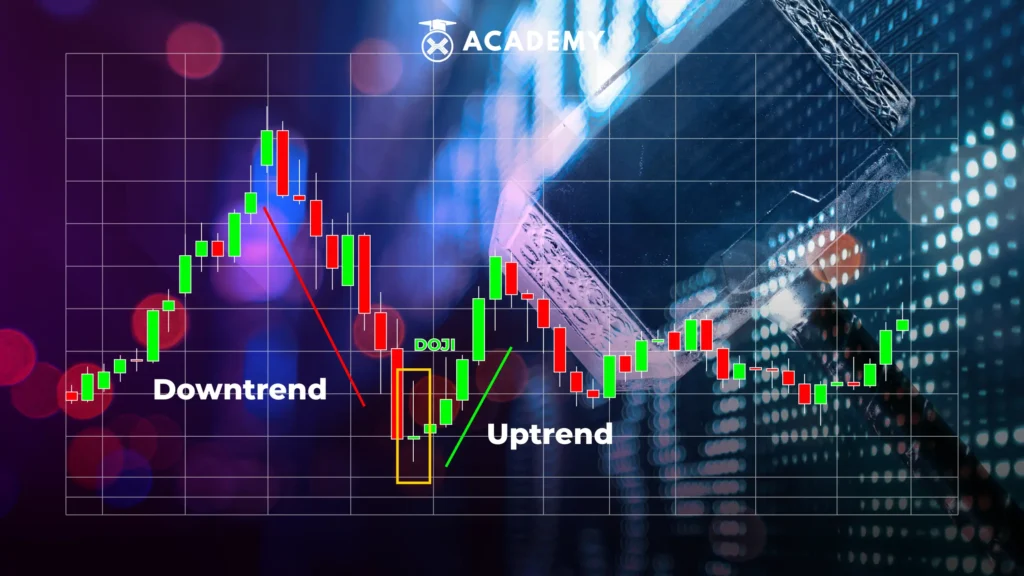
Difference between Bullish Hammer and Doji
Bullish Hammer and Doji candles are the two most popular candlestick patterns and are widely used by traders who use technical analysis.
Both indicate a potential reversal or continuation of the current trend. The Bullish Hammer is a bearish pattern with a long lower wick and a small real body at the top.
The primary difference most easily seen between the Hammer and Doji lies in the body shape of the candlestick. The body of the Doji candle is smaller than that of the hammer candle.
On the other hand, the Doji has nearly the same length of the upper and lower wicks and a distinctly small body indicating indecision in the market.
The Bullish Hammer is formed when prices open at a low price, then move up but are rejected by buyers, causing prices to close closer to the opening price.
This indicates intense buying pressure as buyers push prices up from their lows before sellers can control the price.
A Doji indicates indecision in the market, as buyers and sellers can only maintain control over price action for an extended period.
This tells us that the seller has started selling, but the buyer has stepped in and bought more of what
How to Use the Bullish Hammer in Trading?

There are several ways to use the bullish Hammer as a reference in making decisions when trading.
- Find a trend reversal from bearish to bullish, indicated by the many sellers entering the market during a price decline. After this happens, the price will slowly rise following the Hammer, and a hammer pattern occurs.
- Buy or sell assets.
- Traders who take long positions can place a stop loss below the shadow of the Hammer or at the lowest point of the Hammer.
Examples of Bullish and Bearish Reversal Indicator Patterns
To understand more about the patterns contained in candlesticks, after discussing the bullish Hammer, the following are examples of bullish and bearish reversal indicator patterns:
1. Bullish Reversal
A bullish reversal occurs when the price movement turns downward into a decline in price. This happens because the bullish trend reverses to a downtrend.
2. Hammer Bullish
Hammer Bullish, whose candlestick pattern forms a Hammer. This pattern serves as a bullish indication signal.
3. Morning Star
This pattern is part of a bullish reversal pattern. The morning star appears at the bottom of a downtrend. This indicates that the sellers are losing momentum, and the buyers are taking over the price in an uptrend.
4. Three White Soldiers
The three-white soldier’s pattern is a type of candlestick pattern that is considered a bullish signal.
Three candlesticks in this pattern appear sequentially when the price is bearish or in a downward trend.
5. Bullish Engulfing Candle
The Bullish Engulfing Candle pattern is a signal to open a long position. The market is trending. Usually, a bullish engulfing occurs at the end of a downward trend.
6. Piercing Line
A sharp line is a pattern formed from two candles, called a double candlestick.
The two candles are bearish and bullish. This pattern is formed because the open price is below the close.
7. Bearish Reversal
This pattern is a type of pattern that indicates a potential decline in stock prices. In other words, a bearish reversal is a pattern to watch out for.
8. Bearish Harami
Simply put, a bearish harami is a candlestick position that signals a price trend reversing to a decline in price. The price is experiencing a bearish harami if previously there was an uptrend.
9. Dark Cloud Cover
This pattern includes a type of double candlestick. This pattern is formed if the second open candle is above the first close candle, then the second close candle passes the first close candle.
10. Evening Star
This pattern is considered a reversal pattern from bullish to bearish. Unlike the dark cloud cover, this pattern consists of three candle formations.
The second candle serves as a price reversal signal, and the third candle will indicate a price decline.
11. Shooting Star
This candlestick pattern is formed on the price chart as a bearish signal. The name shooting star is taken because this pattern is shaped like a shooting star.
12. Candlestick Continuation
The name candlestick continuation is taken because there is a pause in a trend then the trend continues again. This pattern can be used to determine entry points in the direction of the trend.
13. Doji
This pattern is pattern that is quite familiar among traders. Doji candles often provide information about a trend reversal.
Conclusion
Before you make a purchase, it’s better to wait for the second candlestick pattern to form after the Bullish Hammer pattern is formed on the support line (sideways), higher low (uptrend), and lower low (downtrend).
After reading the discussion about the bullish Hammer starting from understanding it to how to use it.
Now is the time for you to start investing in crypto assets in INDODAX by buying on the INDODAX market, and you can also learn about it at the INDODAX Academy.
 Market

