A Diamond Pattern is a graphic pattern on trading charts for stock prices, currencies, or other financial assets. One of the most accurate charts in trading is formed when the asset price fluctuates between two sloping trend lines, forming a diamond or rhombus-shaped pattern. This pattern usually consists of two trendlines: an uptrend line connecting price peaks and a downtrend line connecting price valleys. Diamond patterns are often considered signals of trend reversal or continuation, depending on the context of previous price movements.
Diamond Patterns can also be found on crypto price charts, such as Bitcoin, Ethereum, and other altcoins. In the context of the crypto market, this pattern can be considered a potential indicator of a change in price trend. For example, if this pattern forms after an uptrend in prices, it could signal that the uptrend may be ending and prices may move down. On the other hand, if this pattern forms after a downward price trend, it could signal that the downtrend may be ending and prices may move up.
So, to understand more about what the Diamond Pattern is, the characteristics, types, reversal patterns in the diamond pattern, trading strategies for reading signals using the diamond pattern, and how to trade using this pattern, as well as examples, see the following review!
What is A Diamond Pattern?

Diamond Pattern is a type of technical analysis pattern that tends to appear near the top of market price movements. The name “diamond ” comes from its shape which resembles a diamond or hexagonal, which is formed by a trend line that connects the highest and lowest prices of price movements.
The process of forming this pattern involves identifying a head and shoulders pattern that is not in the center of the chart, followed by drawing a trend line based on the peaks and valleys that form. This pattern itself is rare, but when it does appear, it can be a strong indication that an ongoing uptrend may be ending. Its presence appears when the price, which was previously in a strong uptrend, begins to flatten and move sideways for a certain period, forming a diamond pattern. Once formed, this pattern is an indicator of market uncertainty and potential trend reversal.
It should be emphasized that it is important to differentiate the diamond pattern from the more common head and shoulders formation. Mistakes in interpreting this pattern can result in premature trading decisions because this pattern often appears before the head and shoulders pattern is completely formed. Please note, it is important for traders to carry out careful and careful analysis before making trading decisions based on price movements in the market.
Features of Diamond Pattern
The diamond pattern has its own characteristics, which are divided into two parts: a diverging triangle on the left and a symmetrical triangle on the right. The shape often resembles a rhombus and can help traders determine whether the asset will form a high/bullish trendline in the market.
The diamond pattern also functions as a standard confirmation oscillator for reversal patterns. Two types of diamond patterns are the Bullish Diamond Pattern (Diamond Bottom) and the Bearish Diamond Pattern (Diamond Top). This pattern is formed when asset prices change. In the beginning, the highs get higher and the lows get lower. However, price movements produce a pattern over time where the highs become lower and the lows become higher.
By connecting peak points and valley points, this pattern forms a hexagonal shape resembling a diamond, often tilted to one side. Diamond top patterns usually appear at the end of a bullish trendline, while diamond bottom patterns form at the end of a downtrend. Traders pay attention to these patterns because they can provide valuable clues about market direction changes and help make smart investment decisions.
Types of Diamond Pattern
Technical analysts often look for clear signs of trend changes through diamond patterns, as they tend to provide accurate trading signals. Up or down price movements usually follow certain standard patterns, making identifying trends easier.
Many trends begin with a breakout gap, which is followed by a series of runaway gaps as the price continues to move along with the trend. Given that market price fluctuations are continuous, recognizing channel boundary points can effectively predict possible future price changes. By understanding these patterns, traders can make more informed trading decisions and minimize investment risks. The following are the types of diamond patterns that you need to know, namely:
Diamond Top
Diamond Top Pattern, or what is known as the Bearish Diamond Pattern, is a trend reversal pattern that can help detect asset price momentum when it reaches its resistance level. Technical traders look for this pattern to form on a security’s price resistance trend line. Typically, when an asset’s price approaches a resistance trend line, a change in price direction can occur. However, there are also cases when the price breaks through the resistance trend line and continues to rise.
This pattern mostly appears at the end of an uptrend and makes it a strong signal of a change in trend. Visually, this bearish pattern is often similar to a head and shoulders pattern or a flat double-top pattern. With these patterns, traders use them as clues to anticipate potential changes in market direction and make wiser trading decisions.
Diamond Down
The Bullish Diamond Pattern also known as the Diamond Bottom Pattern or Diamond Down is the opposite of the Bearish Diamond Pattern. This bullish pattern appears when the market is in a strong downtrend, characterized by a significant price decline, which is then followed by a period of stability that creates peaks and troughs at the base of this diamond pattern. This pattern is similar to an inverted head and shoulders formation if observed closely. The way to identify this pattern is similar to the Bearish Diamond Pattern, namely by connecting the bullish peaks and valleys using a similar method.
Four trendlines are drawn around this pattern structure to confirm that this pattern is a Bullish Diamond Pattern. If the sizes of the lines are almost the same and form a diamond pattern, then the structure can be considered a Bullish Diamond Pattern. Traders use these patterns as a guideline to recognize potential market opportunities and make smart trading decisions.
Get to Know the Reversal Pattern in the Diamond Pattern

Knowing the reversal pattern in the Diamond Pattern is very important for traders and investors because it can provide in-depth insight into changes in market direction and potentially profitable trading opportunities. The importance of recognizing the reversal pattern in the Diamond Pattern lies in its ability to provide strong clues about market direction, thereby enabling traders to make timely trading decisions and increasing the likelihood of success in financial trading.
The reversal patterns in the Diamond Pattern are divided into two, with the following explanation:
Trend and Reversal of Diamond Pattern
In technical analysis, the main focus is identifying ongoing trends and subsequent reversal patterns, as these patterns often provide profitable trading signals. Uptrends and downtrends often involve a variety of standard patterns that help make trend recognition easier. Most trends start with a breakout gap, followed by several runaway gaps as the price follows the direction of the trend.
Traders use various types of envelope channels by setting upper and lower bounds around a trend to understand a security’s price volatility range and detect potential reversal points. Because security prices tend to fluctuate over time, the limits of these channels are useful for providing an indication of when a reversal may occur. When a diamond top pattern and price oscillator appear, it becomes an interesting opportunity. Price oscillators increase the chances of successful trading by measuring price momentum, identifying weaknesses, and avoiding false breakout/breakdown signals.
Reversal Signal on Diamond Top
Diamond top patterns usually form at the end of an uptrend, making them a strong signal for a reversal. This pattern often resembles an off-center head and shoulders pattern or a horizontal double-top pattern. Traders who identify a potential diamond top will try to draw trendlines around the pattern, creating a diamond shape. The pattern must remain within the boundaries of the trend line to be considered a diamond top. If prices remain within these limits, then trendlines can provide clear resistance and support levels and help traders better plan reversal trades.
The diamond top reversal pattern is one of several reversal patterns that help traders assess a security’s price momentum at its resistance level. Before making a trading decision, most technical traders will look for strong technical patterns, such as a diamond top reversal pattern at a resistance level. If a top diamond reversal pattern is detected, traders will most likely sell (short sell) to profit from a new downtrend.
Trading Strategy for Reading Signals Using the Diamond Pattern
Knowing trading strategies and how to read signals using the Diamond Pattern provides many important advantages for traders. To achieve success in trading, it is important for traders to understand various chart patterns, including the Diamond Pattern, and incorporate this knowledge into their trading strategies. This can give them the edge needed to navigate the complex dynamics of financial markets. The following are trading guidelines and how to read signals using this type of chart pattern, including:
1. Clear Uptrend
Before a diamond pattern can form, it is important that there is clear confirmation of an uptrend first.
2. Connected Trend Lines
In this chart pattern, four trend lines must be connected to each other with almost the same length. This will make it easier to recognize this pattern.
3. Placement of Stop Loss
Setting a stop loss is very important. Stop loss should be placed at the highest point of the last swing before the breakout occurs. The diamond bottom pattern can also be used to help determine the right place to set a stop loss.
4. Placement of Sell Order
As the pattern nears its end, place a sell order when the price breaks and closes below the upward-sloping trendline.
5. Distance Between Points
Use measurable steps to determine target levels. You can measure the distance between the highest high and the lowest low in the structure and project that distance below the breakout point. This level will be a potential point where you can take advantage.
How to Trade Using the Diamond Pattern?
The trading strategy using the diamond pattern is actually quite simple. The reason is, that you only need to determine the entry-level, place to place the stop loss, and profit target. The following is how to trade using the Diamond Pattern using three parameters that can be measured using the Diamond Pattern, including:
1. Entry Market
The diamond pattern indicates the possibility of a reversal in both bullish and bearish market conditions. Therefore, a sell or buy position can be determined based on where this pattern appears; whether it is at the end of a downtrend or an uptrend. Thus, there are two trading scenarios that can be implemented:
- Enter a sell position (sell position entry) if the diamond top pattern forms at the end of an uptrend.
- Enter a buy position (buy position entry) if the diamond bottom pattern is formed at the end of the downtrend.
2. Stop Loss
For stop loss (SL), you can place it in the following area:
- Place a stop loss above the diamond top pattern if you enter a sell position.
- Place a stop loss below the diamond bottom pattern if you enter a buy position.
3. Target Profit
Determining the profit target (profit target) using this pattern is quite easy. Usually, traders will set a profit target parallel to the height of the diamond pattern itself. However, one of the most ideal methods is to set a fixed risk/ reward ratio.
Example of How to Trade Using the Diamond Pattern
To make your understanding easier, here are several examples of applying the Diamond Pattern, including:
1. USD/JPY Timeframe 4 Hours (H4)
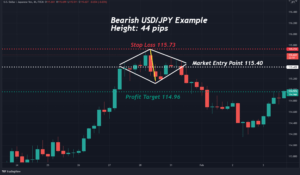
(Image Source: inbizia.com)
Steps for identification and positioning:
- Pay attention to current price movements, for example, the price of the USD/JPY currency pair is increasing.
- Identify the diamond top pattern which is formed by connecting the two highest price points and the two lowest price points to form a diamond-shaped pattern.
- Open a sell position below the diamond top pattern, around the price of 115.40.
- Set a stop loss above the pattern, around price 115.73, to protect your position.
- Set a profit target around the price of 114.96, with a risk/reward ratio of 1:1.
- If the profit target is achieved, then you will achieve a profit of 44 pips.
2. USD/CAD Timeframe Daily (D1)
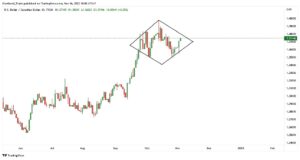
You can observe that before the appearance of the diamond top pattern, the price experienced an upward or bullish trend. The price pattern forms a diamond top pattern by connecting two highest points and two lowest points. The pattern is considered valid when the price bounces inside the diamond area.
Next, confirmation of the diamond top pattern occurs when the price penetrates the pattern’s lower limit. When a breakout occurs, you can make a sell entry.
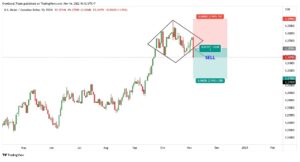
The sell order was successfully executed at the price of 1.35950, right when the diamond top pattern broke out. The stop loss is placed above the diamond pattern, at a price of 1.39950, while the profit target is set at 1.31950, with a risk/ reward ratio of 1:1.
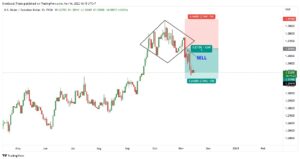
The price continues to decline and almost reaches the profit target of 1.31950.
If you are not satisfied with the 1:1 risk/ reward ratio, you can increase it by entering the Daily time frame. For example, you can enter the H1 time frame and set a stop loss at the nearest supply area. To understand it in more detail, please see the illustration below.
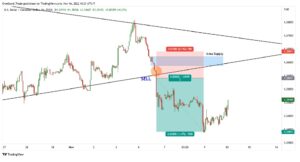
After switching to the H1 time frame, the stop loss, which was 400 pips, has now been adjusted to 100 pips, with reference to the nearest supply area. By reducing the stop loss, you can increase the risk/ reward ratio to 1:2. The profit target can be set to 200 pips, or double the stop loss value. Thus, if the price continues to decline and you succeed in reaching your profit target, the profits you get will be much greater.
3. AUD/NZD Timeframe Daily (D1)
In the AUD/NZD chart below, you can see a diamond bottom pattern, which is formed from the two lowest and highest price points connected by a line. The validity of this pattern has been confirmed because the price managed to penetrate the top of the diamond bottom pattern. To understand it further, please see the image below.
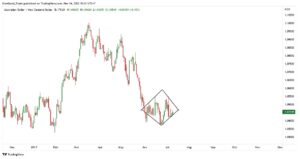
You can open a buy position when the price reaches the breakout at 1.05092. Place a stop loss below the diamond bottom pattern at the price of 1.03662, and set a profit target at 1.06522 with a risk/ reward ratio of 1:1.
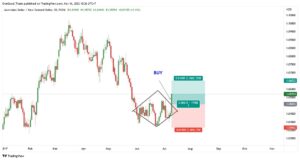
Prices continued to show an increase after the diamond top pattern experienced a breakout and successfully reached the profit target area.
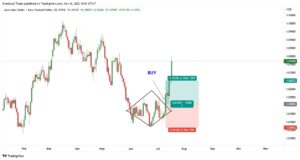
In order to get a lower Risk /Risk: Reward ratio, you can enter the market on a shorter time frame, such as H1, by placing a stop loss below the nearest demand area.

After switching to the H1 time frame, you can execute a buy order at the price of 1.05092, set a stop loss at 1.04392 (70 pips), and set a profit target at 1.06492 (140 pips) with a risk/ reward ratio of 1:2.

As a result, the price continued to show an increase and reached the TP at 1.069492, resulting in a reward of 2R or double the entry on the Daily time frame.
Conclusion
In conclusion, diamond patterns are a type of technical analysis pattern that tends to appear near the top of market price movements. Although this pattern is rare, when it does appear, it can strongly indicate that the ongoing uptrend may be ending. This diamond pattern itself appears when prices, which were previously in a strong uptrend, start to flatten and move sideways for a certain period of time and form a diamond pattern. This pattern shows market uncertainty and potential trend reversal and also has its own characteristics which are divided into two parts, namely a divergent triangle on the left and a symmetrical triangle on the right. The shape often resembles a rhombus and can help traders determine whether the asset will form a high/bullish trendline in the market.
Come on, Trade Crypto Now on INDODAX!
That’s the review regarding the Diamond Pattern, the characteristics, types, reversal patterns in the diamond pattern, trading strategies for reading signals using the diamond pattern, and how to trade using this pattern and examples.
After understanding the Diamond Pattern above, then you can also read other interesting articles, such as complete chart patterns to increase profits. On the other hand, after you have studied the Diamond Pattern and understand how to use the strategy and how to use it, now is the time for you to put it into practice, namely by starting trading crypto assets on INDODAX.
INDODAX is a platform that provides broad access and a variety of crypto assets for traders. Trading on INDODAX will give you the opportunity to test the Diamond Pattern strategy in real time and monitor how this pattern develops in changing market situations while measuring its effectiveness in generating consistent profits. By practicing active trading on INDODAX, you increase your skills and confidence in dealing with the crypto asset market and open up opportunities to achieve long-term success.
So, are you ready to practice the Diamond Pattern strategy? Let’s trade crypto now on INDODAX!


