This week, the bullish crypto asset rankings were led by Hyperliquid (HYPE) in first place, followed by Zerebro (ZEREBRO).
Want to know the performance of your favorite crypto assets? Check the INDODAX Market Signal below
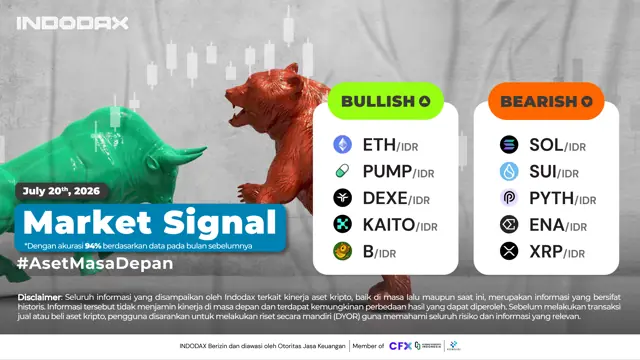
5 Bullish Crypto Assets
1.Ethereum (ETH)

Ethereum (ETH) has repeatedly rebounded from its support at WMA/75 (Green) and WMA/85 (Orange). If it is able to maintain this area this time, Ethereum (ETH) will try to reach its resistance at the 35,000,000 area.
2.Pump.fun (PUMP)

Pump.fun (PUMP) is able to stay in its Bullish zone on the 4-hour (4H) time frame, if it is able to stay above WMA/75 (Green) and WMA/85 (Orange) in the next few days, then Pump.fun (PUMP) will head towards the 33,000 – 35,000 area.
3.DeXe (DEXE)

DeXe (DEXE) is still in its Bullish zone and will try to test the WMA/75 (Green) and WMA/85 (Orange) Support areas in the 500,000 – 450,000 area on the daily (1D) time frame.
4.Kaito (KAITO)

Kaito (KAITO) successfully formed a golden cross between the WMA/75 (Green) and WMA/85 (Orange) with the EMA/200 (Black) on the daily (1D) timeframe. It will attempt to claim its resistance in the 20,000-25,000 area.
5.BUILDon (B)

BUILDon (B) managed to break out from the EMA/200 (Black) on the 4-hour (4H) time frame. If it is able to maintain and claim the area above the EMA/200 (Black) in the next few days, then BUILDon (B) will pursue its psychological figure of around 5,000.
5 Bearish Crypto Assets
1.Solana (SOL)

Solana (SOL) has not yet managed to get out of its Bearish zone and is trying to stay above the WMA/75 (Green) and WMA/85 (Orange), if it fails to maintain this zone, Solana (SOL) will taste support in the range of 1,200,000 – 1,000,000.
2.Sui (SUI)

Sui (SUI) is still moving below WMA/75 (Green) and WMA/85 (Orange) and is in its bearish zone, the key area for Sui (SUI) is around 14,000, if it fails to penetrate this area then Sui (SUI) must still be in its bearish zone.
3.Pyth Network (PYTH)

Pyth Network (PYTH) still failed in its attempt to penetrate the EMA/200 (Black), to be able to get out of its Bearish zone, Pyth Network (PYTH) must be able to claim the area above the EMA/200 (Black) in the range of 1,000 – 1,100.
4.Ethena (ENA)

Ethena (ENA) is still having difficulty in its efforts to penetrate the WMA/75 (Green) and WMA/85 (Orange), if the next attempt still fails, then Ethena (ENA) will head towards its support area in the range of 1,300 – 1,200.
5.XRP (XRP)

XRP (XRP) will try to break through the WMA/75 (Green) and WMA/85 (Orange), if it fails XRP (XRP) will test its support area around 19,200, but if it succeeds XRP (XRP) still has to claim the area above the EMA/200 (Black) to be able to get out of its Bearish zone.
NOTE: If the 5 EMA crosses the WMA 75, 85 and 200 EMA lines and the lines intersect from the bottom up, then the market trend tends to go up (bullish), each table above shows that if the 5 EMA value is higher than the 75.85 WMA and 200 EMA, the market tends to go up (bullish).
If the RSI and MACD values ??show the same condition, it means that the market is showing the same trend. Overbought or oversold conditions are an indicator that the market is already at the point of changing direction of a trend.
ATTENTION: All contents which includes text, analysis, predictions, images in the form of graphics and charts, as well as news published on this website, is only used as trading information, and is not a recommendation or suggestion to take action in transacting either buying or selling. certain crypto assets. All crypto asset trading decisions are independent decisions by the users. Therefore, all risks arising from it, both profit and loss, are not the responsibility of Indodax.
 Polkadot 2.25%
 BNB 0.38%
 Solana 4.19%
 Ethereum 2.32%
 Cardano 1.02%
 Polygon Ecosystem Token 1.87%
 Tron 2.75%
 Market